The waters of Western Port in southeastern Australia are a recreational fishing haven and hidden beneath its turbid waters, a unique fragile seafloor community has been newly described. Here, bryozoans, skeleton-forming filter-feeding organisms also known as ‘lace corals’, form expansive areas of reef that support a high diversity and abundance of macroinvertebrates important to snapper and other prized recreational fish species.
Figure 1: Underwater imagery of the bryozoan reefs revealed remarkable biogenic reef structures with abundant invertebrate life surrounded by large areas of bare sediment.
Fascinating study recently published in the esteemed scientific journal Ecology and Evolution demonstrating how Lowrance HDS and BioBase were used to create the first bathymetric and vegetation map of Lake Ossa in Cameroon, Africa. These maps along with other environmental data collected by researchers were used to create a habitat suitability model for the charismatic African Manatee, whose populations are now threatened in Africa due to habitat degradation.
This is an open access journal from Wiley and available here for download.
Below is the abstract
African manatee (Trichechus senegalensis) habitat suitability at Lake Ossa, Cameroon, using trophic state models and predictions of submerged aquatic vegetation
Aristide K. Takoukam, Dylan G. E. Gomes, Mark V. Hoyer, Lucy W. Keith-Diagne, Robert K. Bonde, Ruth Francis-Floyd,
First published: 07 October 2021
Abstract
The present study aims at investigating the past and current trophic status of Lake Ossa and evaluating its potential impact on African manatee health. Lake Ossa is known as a refuge for the threatened African manatees in Cameroon. Little information exists on the water quality and health of the ecosystem as reflected by its chemical and biological characteristics. Aquatic biotic and abiotic parameters including water clarity, nitrogen, phosphorous, and chlorophyll concentrations were measured monthly during four months at each of 18 water sampling stations evenly distributed across the lake. These parameters were then compared with historical values obtained from the literature to examine the dynamic trophic state of Lake Ossa. Results indicate that Lake Ossa’s trophic state parameters doubled in only three decades (from 1985 to 2016), moving from a mesotrophic to a eutrophic state. The decreasing nutrient gradient moving from the mouth of the lake (in the south) to the north indicates that the flow of the adjacent Sanaga River is the primary source of nutrient input. Further analysis suggests that the poor transparency of the lake is not associated with chlorophyll concentrations but rather with the suspended sediments brought-in by the Sanaga River. Consequently, our model demonstrated that despite nutrient enrichment, less than 5% of the lake bottom surface sustained submerged aquatic vegetation. Thus, shoreline emergent vegetation is the primary food available for the local manatee population. During the dry season, water recedes drastically and disconnects from the dominant shoreline emergent vegetation, decreasing accessibility for manatees. The current study revealed major environmental concerns (eutrophication and sedimentation) that may negatively impact habitat quality for manatees. The information from the results will be key for the development of the management plan of the lake and its manatee population. Efficient land use and water management across the entire watershed may be necessary to mitigate such issues.
First ever bathymetric map of Lake Ossa in Cameroon created with Lowrance HDS and BioBase. Lake map can be viewed in genesismaps.com/socialmap.
Sonar technology continues to improve bringing anglers and aquatic managers better, more clear pictures of the underwater environment on which they are so intently focused. Launched in 2011, BioBase’s EcoSound technology was the first cloud aquatic mapping system designed to process sonar logs from off-the-shelf Lowrance® sonar and create maps of bathymetry, aquatic vegetation biovolume, and bottom hardness for aquatic resource professionals. Today, BioBase is the leading cloud software solution for automated lake and coastal seagrass mapping.
Between 2011 and 2014, the algorithm underwent five major revisions. The bottom hardness algorithm has undergone two major revisions, with the last one in 2014. Thus, our code base was due for an overhaul in order to maintain performance and compatibility with newer generation Lowrance and Simrad sonar. This refactoring effort was also an opportunity for us to improve the vegetation and bottom hardness algorithms. Many of these improvements also carry over sister consumer technology C-MAP Genesis, which uses many of the same algorithms and backend processing architecture
BioBase’s primary strength is its power as an automated processing engine delivering high quality geospatial data layers on aquatic habitats with very little user input outside of the physical effort to drive a boat and passively log sonar over an area of interest. In addition to the online analysis tools within BioBase like the polygon tool and automated statistical reports, users can export raw depth, vegetation, and bottom hardness data along their track, in X,Y,Z grid format, Google Earth imagery, Lowrance or Simrad Charts, AND NOW ESRI SHAPEFILES OF DEPTH CONTOURS! This feature has been in high demand for survey companies and governments who require detailed water volume analysis for aquatic habitat and fisheries management. Below we walk you through some helpful tips about the feature and how to use it.
Go To Tools – Export Options and click “Export Shapefiles”
D_Areas are polygon areas of each contour interval. D_Contours are contour polylines. NOTE: shapefile exports’ coordinate system is WGS 1984 (CRS 4326).
Example from a small lake:
589.3 acre (2,384,812.5 sq. m) lake as viewed in BioBase.Depth Areas as polygons are bundled into the zipped export. This will allow the user to carry out detailed water volume analysis as a function of depth with fewer post-processing steps than were originally required when data was only exportable as points. The MAX_ELEV field in the Attribute table is the contour value in meters and MIN_ELEV is the outer range or deeper contour value of the Depth Area polygon.
The D_Areas shapefile contains many overlapping, redundant polygon features that need to be deleted. To determine which rows to delete, calculate the difference between the max and min elevation values and only keep the rows with a difference of 1 foot (0.3048 meters).
For a complete video tutorial on working with D_Areas shapefiles please visit our YouTube channel.
Exported 1ft contours. The user can control whether contours are displayed in imperial or metric In BioBase, but the values are always stored in metric (e.g., for the 1ft contour, the VALUE field in the attribute table will show 0.3048). For metric contours, they come out in 0.25m intervals.
Shapefiles for vegetation and bottom hardness layers are also available for export as BioBase continues its mission to deliver water and fisheries resource professionals high value data products in the hopes that you can focus less of your efforts on making maps and more on the important tasks of research and conservation.
2020 has been a busy year for BioBase improvements and new feature releases. Previously exclusive to BioBase’s sister consumer mapping platform, C-MAP Genesis, BioBase users can now export their bathymetric, aquatic vegetation heatmap, or bottom hardness map in a file format (AT5) that is compatible with most newer generation Lowrance and Simrad chartplotters. This feature enables researchers and aquatic resource managers to return to surveyed areas of interest and precisely target follow-up surveys or management actions (e.g., strategic taking of water or aquatic plant samples, placement of fish habitat structures or aeration equipment, precision applications of aquatic herbicides, etc.)
In the images and captions below, we’ll walk you through how to do this in your biobasemaps.com account.
1. Export the GPS Chart file from the desired EcoSound Trip or Merge from BioBase.
In the Export Data tool, select “GPS Chart Generation”Export the desired layers
3. Unzip the downloaded file and save to a MicroSD card (<32 GB).
The layer will export as .zip with a random GUID name. The zip file must be unzipped (7-Zip is a great freeware for unzipping files) and the entire contents of the extracted zip file should be copied to a MicroSD card. The contents in the folder are propriety, encrypted files (.AT5) that are specific to the device you registered in your account. The chart file will not work in other non-registered devices. You can register multiple devices. One card can hold multiple AT5 folders (charts) and recorded sonar logs. Cards cannot be larger than 32 GB however.
2. View and Use in your Lowrance or Simrad!
Insert the card with the saved AT5 chart files. Go to the Chart and select the appropriate Chart Source in Chart Options. Voilà!Sample bottom hardness map from the same BioBase survey.If you want to view a blue- (or custom-) shaded contour map, simply uncheck the Vegetation/Composition categories in one of the Chart menus.Detailed, custom-made bathymetric chart. Note that prior to using for navigation, close attention by the user should be given to the quality of the sonar data recorded and resulting accuracy of the map.
At C-MAP, we are excited to announce the release of a new feature that allows users to export exact replicates of their BioBase EcoSound maps as Google Earth images (.kmz and .kml; Figure 1). This YouTube video will walk you through how it’s done.
Figure 1. Image of seagrass cover in Newport Bay, CA USA mapped with Lowrance, processed with BioBase EcoSound and exported as a Google Earth .kmz file. Example can be found in the free demo account on http://www.biobasemaps.com.
BioBase processed raw sonar logs and creates habitat maps with sophisticated algorithms. The outputs you see in BioBase are tiled georectified images (.png) of the outputs. The Google Earth feature converts the .png images to Google Earth’s .kml and .kmz file format. .kml downloads are smaller and reference the images on BioBase servers. .kmz downloads are larger and are exact copies of the images stored on our servers. The .kmz option is best for users who wish to archive local copies of their BioBase maps.
These images allow BioBase users to share spatial files with their stakeholders in a free Google format with which many are familiar and use regularly. Recipients can interact with the output zooming in and out to their desire and also adding custom logos and waypoints as they wish (Figure 2).
Figure 2. Add your own logos and other information to the Google Earth exported BioBase EcoSound image
Further, there are a range of open source tools that will convert .kml and .kmz to GIS files for use in ESRI and QGIS products. Given the popularity and widespread use of .kml and .kmz files, there are a range of other applications that we are eager to hear about. Please feel free to share in the comments below.
Converting EcoSound .kml/.kmz files to ESRI Layers (.lyr)
Special thank you to Kevin Johnson and Jennifer Moran at FL Fish and Wildlife Conservation Commission for sharing a tutorial about how to convert .kml/.kmz files to ESRI Layer (.lyr) files for analysis and overlays in ESRI GIS products:
Open ArcMap
Open ArcToolbox > Conversion Tools > From KML > KML to Layer
Input KML File
Toggle to saved .KML file Lake_Kerr_Biobase.kml (example) > Open
Output Location
Default output location is Documents\ArcGIS > Click the folder icon on right and toggle to appropriate folder
Output Data Name (Optional)
Will typically show the name of the kml, change if preferred
Select Checkbox for Include Ground Overlay (optional)
Only necessary for Raster data. Not necessary for lines/points/polygons
*This will take some time to process/load and will show up in ArcCatalog as “FileName.lyr”. Processing will depend on the file and image size. After it displays in the catalog, drag and drop or select Add Data to display the layer on the map.
**Arc GIS may shut down/disappear. You may not receive a green checkmark for execution completion. Reopen the program and go into your Catalog. Should not need to reconvert from .kml.
Lake Kerr (FL USA) aquatic vegetation heat map as seen in BioBaseLake Kerr (FL USA) aquatic vegetation heat map as seen in Google EarthLake Kerr (FL USA) aquatic vegetation heat map converted to a .lyr file in ArcGIS
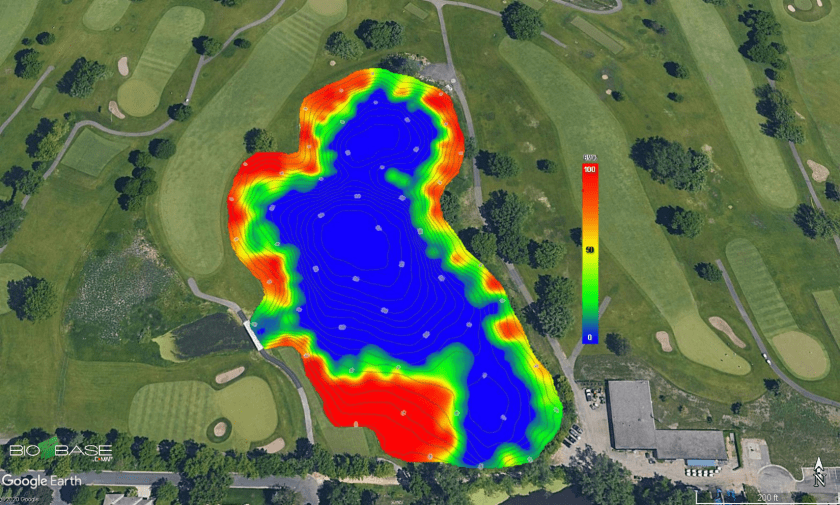
One of BioBase’s strengths is its simplicity. You don’t need an advanced engineering degree in hydrography to make a high quality bathymetric map with an off-the-shelf sonar device. If you have your transducer installed correctly, settings correct on your Lowrance, and achieve good coverage on your waterbody of interest, then BioBase’s EcoSound algorithm will produce a very precise, high quality bathymetric map output within minutes of upload to biobasemaps.com. The speed and ease of bathymetric mapping wins the day for many of our users, but perhaps even more valuable, is the benchmark you are setting for an unknown day in the future when something has changed on the lake and you need to have some “historical” information to understand how much change has taken place
Use Case: Monitoring Sedimentation
One of our most frequently asked questions by new users is “will BioBase measure sediment thickness or the depth of the sludge?” This was a source of a recent blog. Interestingly, the answer is different depending on how long our customers have been using BioBase. For the user who has no prior information about how deep the lake or pond is supposed to be, BioBase may not provide detailed enough information about the actual thickness of the sediment (sediment depth is correlated with EcoSound hardness but it is highly variable; see this blog for further details). However, for the pond management consultant who happened to “BioBase” a client’s pond in 2013 while she happened to be on site for another matter and is now hearing from the client in 2022 that his pond is “filling in,” the answer about whether BioBase can tell him how much sediment has filled in is a most definite yes! For this pond consultant, it was a most fortuitous (or perhaps prudent?) thing that she decided to voluntarily map her clients pond in 2013. Now with a 2022 survey, she can precisely quantify exactly how much sediment has accumulated and where over the 7 years by doing a simple subtraction of the depth and water volume between surveys and comparing maps. The comparison of maps can be done a fancy GIS way like described in this blog. Or a quick and easy way through BioBase (see examples below).
River channel thalwegs (the line of lowest elevation within a valley or watercourse) are often dynamic, and sometimes hidden features of large river systems. Especially low slope or impounded systems. The thalweg is a critical geomorphological feature of river and reservoir systems and affects everything from sediment transport, to fisheries habitat, to algae or invasive plant control.
Thus a good bathymetric contour map is a necessary pre-requisite for effective river and reservoir management. Here, we walk you through how to use new real time technologies (C-MAP’s Genesis Live) to produce smooth, precise, and accurate maps of hidden river thalwegs all within one trip to the site and with automated post-processing with BioBase’s EcoSound. We’ll use an annotated image gallery to take you through this process.
Another FAQ we get is wondering if there are published studies using BioBase technology? There are many legacy applications on which the BioBase technology is based. Further, now that a sufficient passage of years has accumulated to support the research to publication cycle, we’re happy to share several BioBase-specific studies published in the peer-reviewed literature. We also cite some other key papers highlighting the use of consumer sonar technology for scientific research. This is far from an exhaustive list, especially with the growing body of references focusing on mapping with consumer side-scan. If there are good published papers you know of that are not on this list, please share in the comments.