BioBase’s primary strength is its power as an automated processing engine delivering high quality geospatial data layers on aquatic habitats with very little user input outside of the physical effort to drive a boat and passively log sonar over an area of interest. In addition to the online analysis tools within BioBase like the polygon tool and automated statistical reports, users can export raw depth, vegetation, and bottom hardness data along their track, in X,Y,Z grid format, Google Earth imagery, Lowrance or Simrad Charts, AND NOW ESRI SHAPEFILES OF DEPTH CONTOURS! This feature has been in high demand for survey companies and governments who require detailed water volume analysis for aquatic habitat and fisheries management. Below we walk you through some helpful tips about the feature and how to use it.
Go To Tools – Export Data and click “Depth Shapefiles”
Example from a big lake:
D_Areas are polygon areas of each contour interval. Depending on your needs, you can calculate water volume by depth with the area of these “disks” or dissolve them to create a custom colored depth chart. D_Contours are contour polylines. NOTE: shapefile exports do not come with a projection and are in the WGS 84 global coordinate system (CRS 4326). If your GIS system doesn’t like you and says it can’t draw because there is no projection, select WGS84.
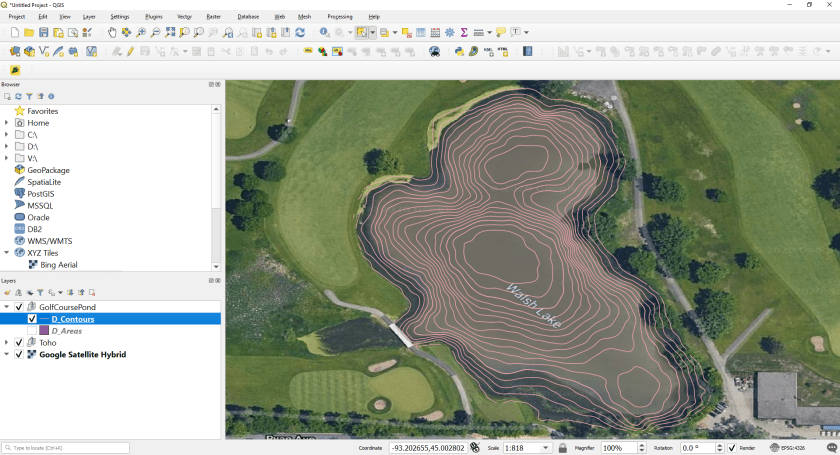
Example from a small pond:
5.8 acre (24,281 sq. m) pond as viewed in BioBaseExported 1ft contours. The user can control whether contours are in imperial or metric, but the values are always stored in metric (e.g., for the 1ft contour, the VALUE field in the attribute table will show 0.3048). For metric contours, they come out in 0.25m intervalsDepth Areas as polygons are also bundled into the zipped export. This will allow the user to carry out detailed water volume analysis as a function of depth with fewer post-processing steps than were originally required when data was only exportable as points. The VALUE field in the Attribute table is the Contour value in meters and VALUE2 is the outer range or deeper contour value of the Depth Area polygon.
BioBase continues its mission to deliver water and fisheries resource professionals high value data products in the hopes that you can focus less of your efforts on making maps and more on the important tasks of research and conservation.