A. Adams, M. De Jesus, G. Cummings, and M. Farooqi
Texas Parks and Wildlife Department, Inland Fisheries
Abstract:
Texas Parks and Wildlife Department Inland Fisheries (TPWD IF) biologists traditionally use “stand-alone” mapping interfaces to generate 2-dimensional (2-D) aerial outputs of fish habitat and benthic surveys of aquatic systems. Preliminary work has shown promise in the use of a different method, which generates interactive 3-dimensional (3-D) high-definition (HD) outputs. During field surveys, a Lowrance© Elite 9Ti GPS unit with TotalScan™ transducer was used to generate data points along boat transects on waterbodies of interest. A waterbody “Vegetation Analysis Report” and HD maps were then generated from these data using web-based mapping algorithms through BioBase©, and ArcMap 10.3© GIS software. Aquatic vegetation biovolume, bathymetric mapping, and benthic substrate composition outputs, produced by BioBase© aided biologists in selecting best management strategies, regarding aquatic vegetation management and angler access development at three central Texas impoundments. This tool can prove valuable to fisheries managers needing a higher resolution of survey results to fine-tune management strategies. At a cost of $2,5001 US for a yearlong subscription, cost-benefit would have to be assessed by individual users, based on their needs.
Introduction:
Limnic waterbodies can host rugous benthic features, submerged aquatic vegetation, and bottom densities that vary greatly. These attributes relate to fisheries dynamics in the form of fish habitat and angler access, playing important roles in management strategies. These reservoir features undergo changes over time. TPWD IF biologists monitor public aquatic habitats to assess trends and make recommendations for necessary adjustments to help provide the best angling opportunities possible. A survey methodology frequently practiced by biologists requires a multitool approach, with 2-D mapping output. This aerial output relies on ground-truthing for species identification, then manual habitat tracing using sonar imagery in association with an independent Trimble© unit to record georeferenced mapping data, and ArcMap© Geographic Information System (GIS) software to develop visual outputs. Soil composition, vegetation biovolume, and bathymetry cannot be factored with this method. However, these factors can provide higher-resolution data, useful in finetuning management approaches. HD bathymetry, aquatic vegetation biovolume, and soil composition (bottom hardness) maps can be created using an integrated system, using the webbase platform BioBase©. These enhanced outputs have been utilized to address fisheries management issues in central Texas.
Methods:
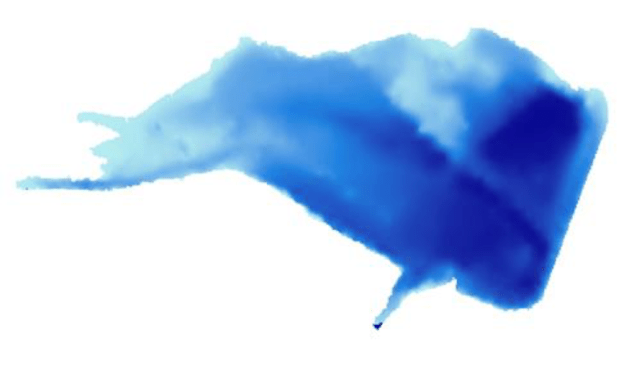
Fish habitat and access issues in three central Texas impoundments were examined using BioBase©, an interactive web-based processing tool. Lake Pflugerville is a 180-acre city reservoir in Travis County, threatened by hydrilla (Hydrilla verticillata) overgrowth, causing access and aesthetic issues for constituents. Lakewood Lake is a 47-acre soil conservation reservoir located in Williamson County on the southern border of the City of Leander. Lake Austin is a 1,589-acre impoundment of the Colorado River within the City of Austin, Texas, Travis County. Fish habitat restoration is a main management goal for this reservoir. Mapping transects were run throughout these waterbodies using outboard aluminum crafts ranging from 4.9 m (16 ft) to 7.3 m (24 ft). Hand-written recordings of field markers were made to recollect boat positioning for ground-truthing. A metal rake head, fixed to rope, was used to collect and identify aquatic vegetation graphed by sonar. A Lowrance© Elite 9Ti GPS unit, partnered with a TotalScan™ transducer (Figure 1) was used to record GPS and HD side-scan sonar imagery data.

Lake-wide navigational transects (Figure 2) were completed at consistent distances between each other, where possible, while making course corrections, where necessary, to avoid hazardous structures or dense submerged vegetation.

Specific survey settings were recommended by BioBase©, including GPS unit setup and transect speeds, based on targeted survey features. Maximum navigational speeds were kept under 32 km/h (20 mph) for bathymetric measures; 19 km/h (12 mph) for vegetation measures and 16 km/h (10 mph) for bottom composition data. However speed adjustments were made around navigational impediments. Files were recorded to a micro SD card in .sl2 format. Transect files were loaded via an online upload tool on the BioBase© website. Data for the smaller impoundments, Lakewood Lake and Lake Pflugerville, were uploaded as single files, whereas Lake Austin was divided up into multiple work day files and uploaded over the course of several weeks, using a function to merge multiple trips into one output report. After initial processing, further tuning, including changing track buffers to fill in gaps in coverage, deletion of erroneous tracking data, caused by dense vegetation, and sonar playback were done to achieve accurate results. While all data were recorded on the website, raw ping GPS grid data were made available for external processing and mapping. Grid data were downloaded as a .txt file and then manipulated in ArcMap© 10.3 using feature conversions, spatial analyst splining and clipping tools. Customized output maps of bathymetry, aquatic vegetation biovolume, and soil composition were produced.
Results:
Lake Pflugerville
Bathymetry and aquatic vegetation biovolume maps were produced with ArcMap© 10.3 using data processed in BioBase©. (Figure 3)

A BioBase© “Vegetation Analysis Report” (Figure 4) revealed that the average vegetation biovolume (BVw) comprised 44.6% ±30.5% of the entire water column surveyed at Lake Pflugerville.

Data were retained on the BioBase© web server for future trend analyses. Trend analyses will allow biologists to develop and evaluate aquatic vegetation control approaches with better resolution, improving the protection of available fish habitat. In contrast, the traditional 2-D aerial survey (Figure 5) only revealed species composition coverage with higher potential for error. Aquatic vegetation biovolume would likely serve as a better metric to develop aquatic vegetation control plans.

Lakewood Lake
The north shore of Lakewood Lake was purchased by the City of Leander to develop a public park with access to the lake. Fishing access features, including a fishing pier and kayak launch, were part of the development plan. A soil composition map (Figure 6) and bathymetry map (Figure 7) for Lakewood Lake were created from transect data. The soil composition map revealed soft and hard bottom areas, represented by deeper silted areas and shallow lesssilted areas with some exposed limestone, respectively. When layered over the bathymetry base, recommendations for ideal sites to build the fishing access features could be offered to park developers. For instance; the northeast portion of the lake contained a mix of hard and soft soil composition, adjacent to a relatively steep bathymetric contour to deep open water. The harder composition along the shoreline allows for the support of pier pilings and the adjacent drop off would serve as a natural route for fish movement and an ideal area to place fish habitat structures to attract fish for pier anglers. Similarly, the soft shoreline area and gentle slope slightly west of the pier site would be ideal area to trench a lagoon feature to host a kayak concession launch.

Lake Austin
The recent loss of aquatic vegetation habitat at Lake Austin from aggressive hydrilla control has caused concern for fishery managers. Efforts to restore aquatic fish habitat and adapting to better gauge the response of hydrilla control have become a priority. The BioBase© tool could potentially help biologists fine-tune monitoring hydrilla responses to triploid grass carp stockings by utilizing the biovolume function rather than the traditional 2-D method. The 3-D method offers better resolution of short-term vegetation changes than the aerial approach since these changes can be morepronounced vertically in the water column that horizontally. Until aquatic vegetation is restored in the reservoir, installing artificial and natural fish habitat structures have become the best restoration option. Ideal depths for these structures tend to be 3.0 – 4.5 m (10 – 15 ft) in central Texas reservoirs. A large-scale fish habitat enhancement project has been funded to improve fishing opportunities at Lake Austin. A high-resolution bathymetry map from BioBase© allowed us to scout optimal areas to conduct the habitat project. A large flat at the desired depth, adjacent to the mouth of Bee Creek proved ideal (Figure 8).

A useful feature in BioBase© allowed us to relate submerged aquatic features to GPS locations by merging the navigational pane with sonar imagery on the same screen. The large shelf selected for our habitat project, at approximately 3.7 m (12 ft) of depth, was confirmed by clicking directly along the navigation track (Figure 9). Exact GPS coordinates were recorded from the grid ping table to mark our future work site.

Conclusions and Implications:
- Compared to traditional aerial methods, 3-D BioBase© mapping outputs offer better resolution for certain fisheries applications (e.g., aquatic vegetation biovolume and soil composition).
- 3-D outputs can be used to fine-tune monitoring of short-term aquatic vegetation density changes caused by control measures. However, it cannot differentiate species like in the traditional aerial method, used by TPWD IF biologists.
- Soil composition and bathymetry maps, combined, can help managers select best areas for water access features.
- BioBase© bathymetry maps, combined with HD sonar views can be utilized to scout ideal submerged areas for artificial fish habitat structures.
- BioBase© web-based processing allows for significantly quicker outputs than traditional aerial methods, including professional tech support.
- BioBase© data can be stored long-term to use in trend analyses, keeping survey data in one server for easy manipulation. Locally-stored traditional aerial data are scattered, requiring longer setups for trend analyses.
- BioBase© hardware is more sensitive to disruption than aerial survey hardware, but corrections can be made to compensate.
- BioBase© annual license cost (US $2,5001) can be restrictive, but the service and quick processing times can be worth it if used frequently.
Acknowledgements:
Funding for the HD hardware and BioBase© license was made possible by Aquatic Vegetation Invasive Species Rider 34 state funding. Remaining efforts and equipment funded by the US Fish and Wildlife Sportfish Restoration Program. A special appreciation to Darin Gossett and John Taylor (TPWD IF) for field support and guidance with ArcMap© usage, respectively.
BioBase Editor notes:

1 Contact sales@biobasemaps.com for up-to-date pricing.