Tips and Tricks: Hypsometric Curve Walkthrough

Hypsometric Curve Using BioBase Depth Outputs

The Critical Role of Hypsometric Curves in Stormwater and Lake Management.

Understanding the bottom contours and bathymetry of a water body is essential for effective lake, pond, and stormwater management. This is where hypsometric curves come into play, serving as a vital tool for environmental scientists and engineers.

hypsographic Curve
Hypsographic Curve Output Using BioBase Data

What are Hypsometric Curves and why are they important?

Hypsometric curves (otherwise known as Hypsographic curves) are graphical representations of the relationship of water volume as a function of depth in a waterbody. We highlight two specific popular examples used by BioBase user community.

1.Using Water Volume Estimations for Proper Pesticide Dosing

By utilizing the depth outputs provided by BioBase, managers can generate these curves to accurately predict pesticide rates at different water levels. This foresight is critical for ensuring that pesticide treatments are both effective, ecologically responsible and cost effective. By understanding the distribution of water volumes, managers can most precisely estimate the amount of pesticide needed to kill their intended target. Pesticides are only effective if you get your concentrations right, and a lake or pond isn’t exactly a bucket with measured graduations. But quantifying water volume in this complicated environments is a purpose for which BioBase was built! In conjunction with hypsometric analysis, the practice of lake drawdown can further refine pesticide application strategies.

2. Aeration Sizing

This is where BioBase’s precise bathymetric and vegetation mapping services become invaluable. By providing detailed underwater topography and plant distribution data, BioBase enables better aeration system design, ensuring that stormwater ponds maintain optimal oxygen levels and ecological balance. By understanding the depth-volume relationship, it’s possible to design aeration systems that can effectively target different water layers, ensuring that oxygenation is not just surface-level but reaches deeper zones where it’s needed.

Case Study Example: In the Kasco Marine case study, LakeTech used BioBase’s cloud platform to create bathymetric maps from sonar data, which helped them design a customized aeration system tailored to the exact contours of the lagoon. The hypsometric curves derived from this data are instrumental in understanding the volume distribution at different depths, ensuring that the aeration system was sized accurately to provide sufficient oxygen throughout the water column.

Aeration calculation with BioBase and LakeTech. https://kascomarine.com/blog/diffused-aeration-partnership-case-study/

For a direct link to the video visit the BioBase Youtube Channel

BioBase is Going Independent!

April 18th 2024

FOR IMMEDIATE RELEASE

The automated cloud mapping platform for waterbodies, BioBase (biobasemaps.com), has recently undergone a change in ownership. Formerly under the Navico Group, a division of the Brunswick Corporation, BioBase has now been acquired by an independent group of investors. In the short term, users can expect minimal changes to the platform, and the development team will continue its operations from St. Paul, MN, USA.

Aquatic resource professionals have the option to subscribe to various plans and utilize the platform to process Lowrance® or Simrad® Sonar Logs in the cloud, generating detailed aquatic maps and GIS datasets. Looking ahead, this transition is expected to pave the way for enhancements in the platform’s capabilities and a quicker development cycle. These enhancements will include the ability to process sonar files of multiple formats and create additional map and data layers valuable to water and fisheries professionals.

“The team is enthusiastic about this new chapter and is eager to solidify BioBase as the premier solution for automated mapping derived from sonar files. Whether it’s mapping depth, aquatic vegetation, or bottom composition, we’re committed to delivering high value maps and datasets with minimal effort. This allows aquatic and fisheries professionals to focus on the important work of aquatic management and conservation and not making a map” stated BioBase President and Product Expert, Ray Valley.

Stay informed about important updates by following us here on this blog, LinkedIn, Facebook, Instagram. For inquiries, please reach out to us at info@biobasemaps.com.

BioBase Feature Alert: Bulk Export Tools

As BioBase has grown through the years, Natural Resource Agencies, Researchers, and Lake Managers have mapped millions of acres of water and aquatic habitats benefitting conservation. But Million’s of acres means millions of files and terabytes of data. BioBase is a great solution for storing, browsing, and analyzing these data, but until now users did not have a way to bulk export processed files. The initial release of the feature will allow users to bulk export .csv data files, Google Earth .kmz for all layers, and Vegetation Analysis Reports from January 1st 2018 through December 1st 2023 for all trips and merges within a waterbody for a user or organization. Future improvements to the feature will expand this window. It’s important to note that already existing export features on a trip by trip basis within the trip viewer (e.g., Tools – Export Data) has not changed.  The export links and data will remain active and available for 30 days. After 30 days, exports will be deleted from BioBase servers and users will need to make another request if they wish to download the files again at a later date.

Feature extracts a .zip file with the Lake Name, a Waterbody ID, and the date YYYYMMDD of the request. Contents in the zip file include other zip files and include sonar file names, Trip ID’s, and other information that should be intuitive for users


Professional Spotlight – Studying Arctic Charr Habitat in Maine

Professional Spotlight – Studying Arctic Charr Habitat in Maine

Greg Kronisch is a PhD student studying the movement ecology and diet of Arctic charr (Salvelinus alpinus) in Maine. These cold-water relatives of brook trout and salmon are found in North America, Europe, and Asia. Throughout their range Arctic charr exhibit a great diversity of size, body shape, and behavior in association with different habitats and diets. While anadromous (sea-running) populations are common in Canada, Alaska, and Europe, their range in the contiguous United States has receded over the past half a century to now only 12 native land-locked populations in Maine. Greg is advised by Dr. Nathan Furey at the University of New Hampshire, Drs. Michael Kinnison and Christina Murphy at the University of Maine on a National Science foundation project to evaluate Arctic charr diversity and ecology in the context of climate change.

An Arctic charr from Floods Pond, Maine being measured and photographed in April 2023. Each fish also receives a unique subdermal tag and a small tissue sample is taken for genetic analysis

Greg is continuing a 20-year project at UMaine that focuses on studying the Arctic charr in Floods Pond near Bangor, Maine which is one of the most southern populations in North America, putting them at risk from warming and species invasions. This population is among the healthiest and well-studied in Maine due in part to strict regulation of Floods Pond as the water supply for the city of Bangor. The long-term dataset on fish morphology, spawning behavior, and population size, and well-maintained access roads makes this the best lake to study Arctic charr in Maine.

Arctic Charr Research Station
Floods Pond Research Station
Floods Pond Research Station Artic Charr Habitat Mapping
Floods Pond

A major part of this research relates to the movement and habitat use of Arctic charr using acoustic telemetry. For this work, fish are anesthetized and a special electronic tag is surgically implanted into the fish’s abdominal cavity. This tag then sends out a transmission every 1-3 minutes to receiving stations throughout the pond, providing information on fish location, depth, and body temperature. The advantage of this method is that the tagged fish only needs to be handled once, but analysis of these detections can produce up to 1,000 position estimates per fish each day (or 525,000 annually).

Diagram of acoustic telemetry. Each transmission (red) is picked up by the receivers (black tubes attached to mooring). Millisecond differences in transmission recording times can be used to calculate high-precision estimates of position.

Initial testing of the receiving stations in April revealed that some receivers were unable to properly communicate, suggesting there might be issues with underwater obstructions. Because of this, Greg needed detailed information of lake depths and structures to set up his telemetry stations in locations that would avoid communication issues and “dead zones” associated with underwater reefs, holes, and large glacial boulders. Additionally, the habitat use of the tagged Arctic charr needs to be informed by an understanding of the lake morphology and available habitats. BioBase quickly come to the rescue for both needs!

An in-progress update of the Floods Pond bathymetry as seen on the BioBase social map.

Greg is leveraging the power of BioBase to stitch together side-scan sonar mosaics showing boulder fields and substrate types and has made great strides re-mapping the bathymetry of Floods Pond. Historically available maps of Floods, mostly based on fewer than 100 depth soundings taken with handlines in 1942, have turned out to be inaccurate in many locations. Once the lake is fully mapped, charr position estimates from the acoustic telemetry array will be used in conjunction with lake bathymetry and substrate hardness layers to better understand seasonal habitat use and spawning behavior of this state species of special conservation concern. Over the next few years Greg plans to map other Maine lakes to understand habitat available to other relic Arctic charr populations and to create habitat suitability models for lakes that do not currently have Arctic charr.

Side Scan mosaic of Floods Pond

When asked how Greg would use the side-scan mosaic he said “I use these implanted tags and receivers to triangulate the fish’s positions every few minutes, but this isn’t terribly informative without also having habitat information. I’m using the physical lake data synthesized in BioBase to find if they trend toward certain substrate/bouldery areas, if they may use secondary deepwater spawning areas, where they are in the water column (ie fish depth vs bathymetry of that area), and how these may change seasonally.”

Side Scan Close up of
Close up of Arctic Charr habitat on Side-Scan mosaic
Greg releasing a tagged Arctic charr back into Floods Pond

For more information about BioBase or other professionals using BioBase like Eli Kersh and LakeTech or completewaters check out other professional spotlight blog posts.  Or for more information on the NSF and other research being done click the link. You can find more on Greg at his Grad Page or the Lab Website.

Following Transects while BioBase Mapping

A frequently asked question of BioBase users is how do you ensure proper coverage of a water body you want to map? Some years ago we published a blog on the topic of aquatic mapping strategies and transect design that is still very relevant today. Here we focus our attention on some practical tips and tricks that takes theory into practice and gives you guides or lines to follow on your Lowrance Chart. Note that we won’t walk you through every screenshot or setting, but rather point you to the key tools and features that will get you started. We do publish more in depth tutorials on biobasemaps.com/supportresources. This isn’t an exhaustive list, so please share additional tips and tricks in the comments!

Continue reading “Following Transects while BioBase Mapping”

Which sonar channel to use to map vegetation? 200 khz or Downscan?

An update to the BioBase sonar file reader released in Feb 2021 included an update that allows the user to select which sonar channel they’d like to process (Primary or Downscan) for vegetation. We call the broadband, traditional sonar channel “Primary” which includes the recommended frequency 200 khz. Most Lowrance transducers have this frequency. If the user selects the .sl2 or .sl3 file format and they have a Downscan-compatible transducer, the file will also include the Downscan channel. Downscan differs from the Primary channel in the size and orientation of the soundwave beam (Figure 1).

Continue reading “Which sonar channel to use to map vegetation? 200 khz or Downscan?”

BioBase Tips and Tricks – Search Feature and Tags

BioBase Tips and Tricks Logo

Is your dashboard getting overwhelming and you need a way to organize trips? Did you know BioBase has a built in feature to help you title and tag trips for better organization? Following the steps below you will be able to tag trips with keywords to help organize and find trips in your dashboard easier. In the example below we want to organize all our trips that contain Seagrass to find them easier in the dashboard.

Locate the “Title and Tag” feature in the toolbar on the left hand side of the trip viewer
The Title and Tags menu will pop up


Add titles and tags as needed, here w are going to add “Seagrass” to the tag line and “Florida Keys” to the title. Then Click the Save buttons.
The “Search Bar” is at the top of the dashboard and is in the default quick search option.
The advance search feature gives you even more options to filter trips.

For tips on Archiving Trips take a look at our other blog posts, or visit www.biobasemaps.com

Professional Spotlight – completewaters

BioBase Professional Spotlight

In our latest edition of Professional Spotlight, we turn our attention to completewaters, a dynamic company led by Blake and Jess Spittle. With a focus on underwater exploration and services, completewaters has carved a niche for itself in the marine industry through their innovative use of BioBase technology. From ROV (Remotely Operated Vehicle) imaging to fish habitat projects, seachests & propeller imaging, and sonar-driven habitat mapping, completewaters has emerged as a trailblazer in underwater operations.

CompleteWaters
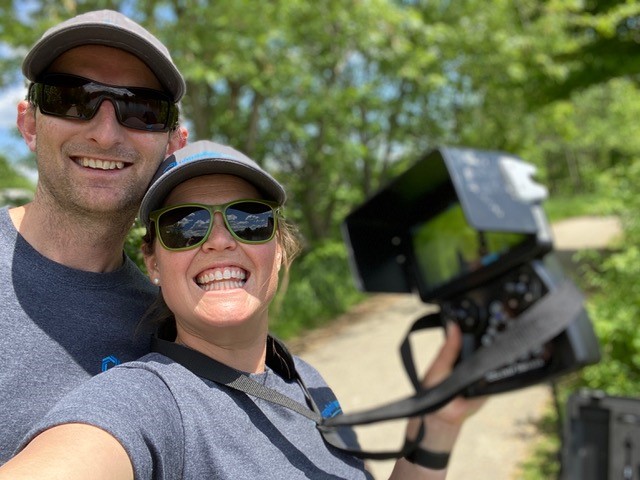
Blake and Jess of CompleteWaters

The genesis of completewaters can be traced back to a water conference where Blake and Jess were captivated by an underwater ROV. Inspired by this encounter, they embarked on their journey after relocating from New Zealand to Canada. Beginning with a single ROV to test the market, they have since expanded their fleet to include multiple ROVs and even a USV (Unmanned Surface Vehicle).

UAV Survey


Unexpectedly, completewaters discovered their forte in the environmental sector, particularly in fish habitat installation and monitoring associated with marine construction projects. Their groundbreaking approach to inspecting intakes, rudders, and propellers using ROVs eliminates the need for human divers, allowing uninterrupted ship operations. This not only saves valuable time for the ships but also reduces downtime, leading to significant cost savings. Given the bustling ferry and cargo ship activity in Lake Ontario and the Great Lakes, completewaters found a sweet spot at the intersection of the shipping and environmental industries.

UAV Pilot, piloting a UAV
UAV In Action

As ferry and cargo ship activity increased in Lake Ontario and the Great Lakes, so did the demand for marine construction projects, including terminal developments. These projects often include restoration work in non-impacted areas of the lake. The underwater photos and videos captured by completewaters throughout the construction process became an integral part of the aquatic biologists’ reports assessing the impact on fish habitats. The transformation from a barren sandy bottom to a thriving ecosystem teeming with fish was vividly showcased through high-definition visuals, impressing biologists and affirming the success of restoration efforts. The recent addition of the Side-Scan feature to their arsenal has added a new level of excitement to this type of monitoring.

Underwater seagrass restoration, underwater vegetation restoration UAV
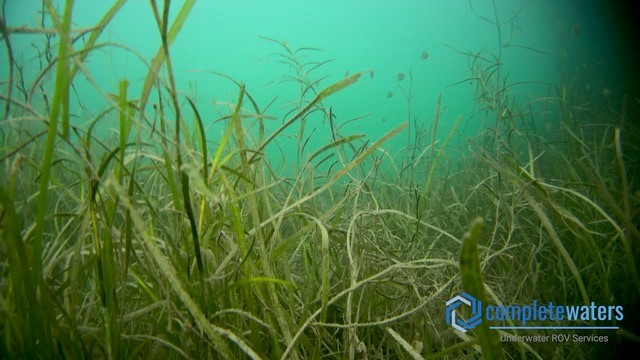
Underwater Vegetation Restoration Project

When asked about their decision to adopt BioBase, completewaters cited the simplicity and accessibility of the technology. They found it to be an easy entry point into the industry, with the fish finder being straightforward to mount and collect data. Running this data through BioBase yielded remarkable accuracy and multiple output deliverables, all from a single trip. The ability to provide comprehensive data outputs with cost-effective efficiency greatly appeals to the environmental industry, especially for projects with tight budgets.

completewaters has leveraged BioBase compatibility to expand their reach beyond Lake Ontario. With over 444 municipalities in Ontario, most of which are rural areas, they can now employ their USV equipped with a BioBase-compatible depth finder to measure small inland waters. This innovative approach has gained popularity, primarily due to the enhanced health and safety measures it offers. By eliminating the need for personnel to manually check sediment levels and inspect water quality on small inland waters, completewaters has proven their commitment to safeguarding the well-being of their employees.

The impact of completewaters on their local community cannot be overstated. Fishermen in the area have approached Blake and Jess on numerous occasions, expressing their astonishment at the improved habitat conditions and the abundance of fish in areas that were previously barren. Over a span of three years, Blake and Jess witnessed firsthand the transformation from a lifeless sandy bottom to the establishment of man-made reefs and tree wads, culminating in a flourishing habitat teeming with fish.

Underwater Fish Photo Taken by UAV
Smallmouth bass spotted by habitat restoration project

In conclusion, completewaters exemplifies the power of innovation and the remarkable outcomes that can be achieved through the integration of BioBase technology in the underwater services industry. Their dedication to environmental preservation and commitment to excellence have not only yielded tangible benefits for their clients but have also left an indelible mark on their community. As they continue to pioneer new frontiers, we eagerly anticipate the future accomplishments of completewaters and their unwavering pursuit of underwater exploration and conservation.

For more information on completewaters visit their website here completewaters website. For more information about BioBase or other professionals using BioBase like  Andrew Skibo, PhD CLM, Amaruq Environmental or Professional Spotlight – LakeTech – Eli Kersh visit our website at www.biobasemaps.com

Getting Started With BioBase-EcoSound

BioBase is a powerful lake, pond, and coastal mapping cloud software tool. To get the best results with BioBase – EcoSound, it is important to use proper data collection and management procedures. This post contains links to the resources that will help you get started with BioBase and get you on your way to collecting quality data.

First, ensure you have a compatible sonar device to use BioBase. BioBase exclusively processes raw sonar files from Navico Group manufactured devices, specifically Lowrance and Simrad. BioBase is compatible with multiple generations of these brands and if it can hold an SD card, you can probably record a compatible .slg, .sl2, or .sl3 sonar log. However, if the unit is greater than 5 years old, it might be time to consider an upgrade. This blog will help you determine the best sonar for your application. Please note that the GPS antenna is embedded into the display so if you have a console-steer boat, you should consider acquiring an external GPS antenna like the Lowrance Point-1 GPS or Simrad GS25 that can be affixed to a position on the boat that is directly over the transducer.

THE SINGLE MOST IMPORTANT INSTALLATION DETAIL IS PROPER INSTALLATION OF YOUR TRANSDUCER. This is the most overlooked detail and means the difference between a very high quality output and a very poor one. If you are still uncomfortable installing your transducer after reading this blog on transducer installation, then we suggest taking your boat to a service center and having it professionally installed.

Our quality control team reviews every uploaded trip, creates or fixes shoreline boundaries according to the Bing aerial photo basemap, and looks for glaring issues like evidence of a slanted transducer, signal loss, and poor signal quality.  They may email you if they notice any significant issues with your trip, and suggest ways to fix the issue or ways to improve data quality before logging again. Please allow one business day for quality control to review your trip and fix waterbody boundaries if needed. If there is a quality control section in the report’s header, then trip has been reviewed (note, the quality control team does not generally review merges). You can also see any comments that were not emailed to you on the report.

It is critically important to keep your Lowrance software updated. Software updates can be found here. Using hardware with outdated operating system software can result in a range of issues.

Our blog blog.biobasemaps.com and our Support Resources Page is full of good content for “How Tos,” case studies, feature descriptions, etc. Use the search tool within the blog to search any particular topic.

Our YouTube channel has many helpful videos, including field demos and data editing tutorials.

This post gives you a more in depth look at how EcoSound works. This blog shares some tips and tricks along with some answers to frequently asked questions that many new users have.

The EcoSound Support and Resources page has links to the EcoSound Full Operator’s Guide including a slick online manual with full keyword search functionality. There are several tutorials, including guides for using EcoSound data in QGIS. The EcoSound Quick Start Guide shows recommended settings to use on your Lowrance or Simrad while logging sonar. Please follow this quick start guide carefully.

Finally, we have a Facebook BioBase Tips and Tricks Group page that you may consider joining to ask questions of the user community.

If you ever need any assistance, contact the BioBase support team at info@biobasemaps.com

Weeds and Grass: mysterious and underappreciated treasures of the sea

Given the disdain for the word “weed,” it’s not surprising that seaweed gets such little respect in most developed human cultures. But, we are finding seaweed and its rooted cousin seagrass hold immeasurable value for the future of humankind. Time to get to work mapping it!

Seagrasses are considered vascular plants and have roots, stems, leaves, and flowers. According to a report from the United Nations in 2020, there are more than 70 species across the globe covering over 300,000 km2 (which is likely a vast underestimate) making them one of the most widespread coastal habitats.

Figure 1. Posidonia seagrass growing off the Mediterranean Coast of Spain. See us map it

Continue reading “Weeds and Grass: mysterious and underappreciated treasures of the sea”

Translate »