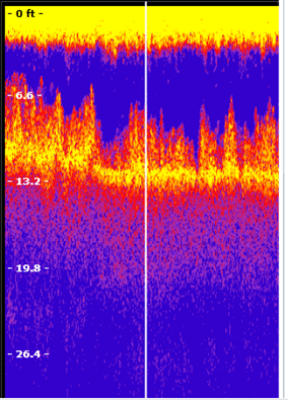
EcoSound is a powerful and intuitive aquatic resource data processing engine that professionals across the globe are coming to recognize. However, the quality of automated outputs greatly hinge on a proper Lowrance transducer mount. If the transducer is off at an angle, the acoustic cone will intercept bottom at an angle and will falsely read depth, bottom composition/hardness, and vegetation height (Figure 1).
 |
| Figure 1. Example sonar log from a transducer face that is not 180 degrees with bottom as seen in Lowrance’s SonarViewer |
Strategies for installing your transducer.
There are a wealth of online resources via YouTube, Google, and our own blog series (for example see our portability blog) about proper transducer mounts. Just search “Lowrance Transducer Installation” and you’ll have a wealth of self-help resources at your disposal. An output from a properly mounted transducer should look like Figures 2 and 3 where the bottom signal is clearly distinguishable from aquatic vegetation.
 |
| Figure 2. Screen shot from a Lowrance HDS7 Gen2 Touch of a clear bottom signal and submerged aquatic vegetation from a properly mounted 200 kHz skimmer transducer. |
 |
| Figure 3. Example of what a clear 200 kHz signal over a vegetated bottom looks like in the EcoSound Trip Replay screen. |
Often, aquatic vegetation grows to the surface of lakes and one of the unique strengths of EcoSound is that the vegetation detection algorithm recognizes conditions that appear to be surface growing vegetation and classifies the growth as such (i.e., biovolume = 100%). Still, in order for the algorithm to function in these environments, some signal must periodically pass through the vegetation canopy and get “peaks” at bottom deeper than 2.4 ft (EcoSound minimum depth for vegetation mapping; Figure 4). If you are mapping areas shallower than this depth, you can add manual vegetation coordinates to unmapped areas (see a CI YouTube video on how to do this)
 |
| Figure 4. Example of a good signal in surface growing vegetation. The bottom still tracks occasional depths of greater than 2.4 feet. Long periods of no depth signal or depths less than 2.4 feet will result in unmapped areas and will require manually adding vegetation coordinates to your EcoSound output. |
Monitor SONAR screen while you map
Because having a clear transducer signal is so critical for quality EcoSound data and map products we recommend that users verify a clear Sonar signal in an open water area prior to logging. Drive your boat at different speeds and evaluate at what speed “slivers” start to appear in the bottom signal (Figure 5). These slivers represent acoustic “misses” and typically result from cavitation of water around the transducer face. Periodic slivers or misses while recording are ok, but we recommend that users monitor their SONAR page and take measures to minimize these disturbances (e.g., slow down or adjust the depth of the transducer a few inches – sometimes that’s all it takes).
 |
| Figure 5. An example of where the acoustic signal “missed” the bottom target (white slivered areas). These misses typically result from either an improper transducer mount or excessive speed of travel that causes cavitation near the transducer face. |
A Transducer Field Checklist
It might be helpful to ask these questions prior or during recording while looking at your SONAR screen and if the answer is yes to any of them, stop recording and make adjustments.
- Does the bottom, fish, or plant targets appear slanted?
- Does yellow surface clutter extend a long way into the water column and might possibly obscure vegetation target separation?
- Is my depth signal flashing or am I getting no digital reading?
- Is my range window jumping around indicating it can’t find depth?
- Am I getting a lot of white slivers in my bottom reading?
Editing your EcoSound output
If bad signal does sneak past your scrutinizing eyes, fear not, you can always edit your output with EcoSound’s Trip Replay feature as seen in our YouTube video series.
By installing your transducer correctly and monitoring your output you’re almost guaranteed a quality map of lake, river, or coastal habitats with EcoSound. Contact us at info@biobasemaps.com to learn more.
Like this:
Like Loading...


