BioBase is excited to announce the launch a new map layer for Fisheries and Coastal researchers derived from side-scan sonar.

The ultrasound-like high definition imagery of new generation Lowrance side-scan transducers (e.g., Active Imaging 3in1 and Active Imaging HD) can now be processed in BioBase and viewed with other traditional habitat data layers (e.g., depth, vegetation density, and bottom hardness). The Side-scan channel is already included in .sl2 and .sl3 files if you have a compatible transducer* so one file gives you all four BioBase Layers! Side-scan mosaics from off-the-shelf sonar has long been a valuable tool for Fisheries researchers interested in identifying and protecting important habitats and has been the source of several professional research symposia and publications. The automated processing of BioBase has removed the labor-intensive need for manually mosaicking side-scan screenshots from Sonar units or complicated calibration of images in other software packages. BioBase automates this process and creates a high definition image with no user input to the processing. If you create a nice scan on the water, BioBase will reproduce it and make it available to you to analyze with other layers and identify important habitats.
Where side-scan works and where it doesn’t
Side-scan sonar allows the surveyor/angler an ability to see bottom structures and composition types out to the side of their vessel. This feature captures that picture (technically many pictures) and makes it available to the user for more detailed analysis. Shallow fish and patchy seagrass habitats too shallow for traditional downlooking sonar can be surveyed with this technology. Side-scan supports many other uses including, counting large fish like Sturgeon, Oyster bed mapping, search and recovery, and archeological surveys.
However, side-scan is not a good solution for mapping beds of tall dense aquatic plants because stems growing near the surface obscure the side-scan signal. Rather, rely on the traditional BioBase EcoSound Algorithm and interpolation for mapping modest to dense aquatic plant beds.
Further side-scan images will look “smudged” and have streaks if you idle a lot, switch directions frequently, or have a lot of overlapping tracks.

The best imagery comes from slow (1-4 knots) deliberate, non-overlapping passes over a known structure.


“Dialing In” your device to get the best picture
How you “dial in” your Lowrance or Simrad to get the best side-scan picture or understanding what you are seeing on the screen is beyond the scope of this blog. There are many online resources with a simple Google search that will get you helpful content. Pay close attention to your transducer installation and make sure that the side-beams are unobstructed by the outboard’s lower unit or any other part of the boat. If you have your transducer and other system components installed correctly, the default settings on your Lowrance or Simrad should work well. Adjust the color palette, contrast, range, and frequency to give you the clearest picture. The color and contrast are hard coded and not adjustable in BioBase. But, the range and frequency logged to the file will affect the output in BioBase, so make sure you have those “dialed in” while out on the water.
Key Features
Delineate key habitats with the polygon tool

Export to google earth
Our Desktop Google Earth Export Feature has been very popular for other BioBase layers, so we figured we better make it available for side-scan!

Export to GIS


Make Features “POP” with color shading in gis


Export a Basic Map Layout for Sharing

Convert .sl2/3 file to structuremap for display on lowrance
A Lowrance feature developed long ago but little known or used has been structure map or the creation of side-scan mosaics of .sl2/3 files for display and interaction on Lowrance units. These .smf files can be created after the fact on the display in the Storage menu. These structure maps can then live on the display/chart (see screenshots above) and allow you to do follow up surveys or sampling


Sign me up!
If you are new to BioBase, we can help you select the correct Lowrance or Simrad device and get you with a free 30-day BioBase EcoSound trial at https://www.biobasemaps.com/Plans. For existing customers, contact us using the same form to upgrade your account for free to Habitat+ for 30 days

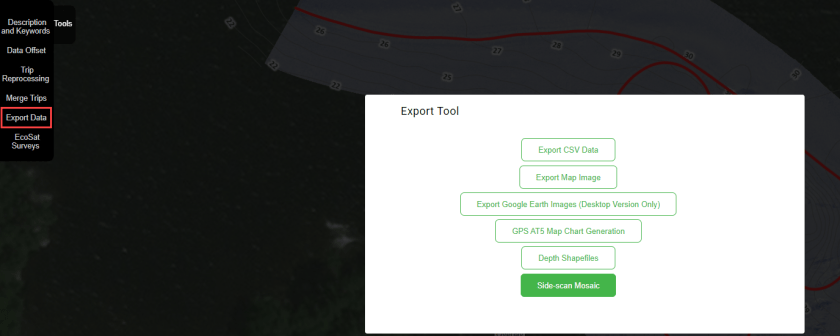
Enabling the side-scan feature
By default, the side-scan mosaic feature is not enabled, even for Habitat+ subscribers. You can enable the feature in two ways:
-
- Enable for all uploads: Go To My Account -> Processing Preference. Enable Side-Scan Mosaic
- Reprocess side-scan for only specific trips (feature is not compatible with merges).


The Fine Print – What is side-scan and how does it work?
The technology is not new and volumes have been written on the topic dating back to at least B.W. Fleming 1976. However, the technology is getting more advanced and costs have gone down dramatically making it accessible technology for anglers and researchers with small budgets. For those interested, here is detailed information on patented Navico side-scan technology. The beauty of processing off-the-shelf technology like Lowrance is that BioBase users can learn from thousands of other users who have developed helpful tutorials and posted them all over the web. For instance, this video from “Fish the Moment” gives a great visual explanation (albeit with some minor inaccuracies highlighted in the comments) of what you are seeing on your Side-scan display translated to a demonstration in a parking lot. Although it focuses on fishing, the lessons are helpful no matter whether you are a surveyor or a Rescue department searching for a drowning victim!
*Side-scan compatible transducers include: Lowrance LSS-1, LSS-2, StructureScan HD, Totalscan, StructureScan 3D, Active Imaging 2in1 and 3in1, Active Imaging HD