From the Peninsula Clarion in Alaska published on 6/19/2014. Story by U.S. Fish and Wildlife Ecologist Mark Laker with the Kenai National Wildlife Refuge.
Continue reading “BioBase In The News: Aquatic Habitat Mapping Off-the-Shelf”
Stay up to date on news and features about aquatic habitat mapping with BioBase
From the Peninsula Clarion in Alaska published on 6/19/2014. Story by U.S. Fish and Wildlife Ecologist Mark Laker with the Kenai National Wildlife Refuge.
Continue reading “BioBase In The News: Aquatic Habitat Mapping Off-the-Shelf”
EcoSound is a powerful and intuitive aquatic resource data processing engine that professionals across the globe are coming to recognize. However, the quality of automated outputs greatly hinge on a proper Lowrance transducer mount. If the transducer is off at an angle, the acoustic cone will intercept bottom at an angle and will falsely read depth, bottom composition/hardness, and vegetation height (Figure 1).
 |
| Figure 1. Example sonar log from a transducer face that is not 180 degrees with bottom as seen in Lowrance’s SonarViewer |
Strategies for installing your transducer.
There are a wealth of online resources via YouTube, Google, and our own blog series (for example see our portability blog) about proper transducer mounts. Just search “Lowrance Transducer Installation” and you’ll have a wealth of self-help resources at your disposal. An output from a properly mounted transducer should look like Figures 2 and 3 where the bottom signal is clearly distinguishable from aquatic vegetation.
 |
| Figure 2. Screen shot from a Lowrance HDS7 Gen2 Touch of a clear bottom signal and submerged aquatic vegetation from a properly mounted 200 kHz skimmer transducer. |
 |
| Figure 3. Example of what a clear 200 kHz signal over a vegetated bottom looks like in the EcoSound Trip Replay screen. |
Often, aquatic vegetation grows to the surface of lakes and one of the unique strengths of EcoSound is that the vegetation detection algorithm recognizes conditions that appear to be surface growing vegetation and classifies the growth as such (i.e., biovolume = 100%). Still, in order for the algorithm to function in these environments, some signal must periodically pass through the vegetation canopy and get “peaks” at bottom deeper than 2.4 ft (EcoSound minimum depth for vegetation mapping; Figure 4). If you are mapping areas shallower than this depth, you can add manual vegetation coordinates to unmapped areas (see a CI YouTube video on how to do this)
 |
| Figure 4. Example of a good signal in surface growing vegetation. The bottom still tracks occasional depths of greater than 2.4 feet. Long periods of no depth signal or depths less than 2.4 feet will result in unmapped areas and will require manually adding vegetation coordinates to your EcoSound output. |
Monitor SONAR screen while you map
Because having a clear transducer signal is so critical for quality EcoSound data and map products we recommend that users verify a clear Sonar signal in an open water area prior to logging. Drive your boat at different speeds and evaluate at what speed “slivers” start to appear in the bottom signal (Figure 5). These slivers represent acoustic “misses” and typically result from cavitation of water around the transducer face. Periodic slivers or misses while recording are ok, but we recommend that users monitor their SONAR page and take measures to minimize these disturbances (e.g., slow down or adjust the depth of the transducer a few inches – sometimes that’s all it takes).
 |
| Figure 5. An example of where the acoustic signal “missed” the bottom target (white slivered areas). These misses typically result from either an improper transducer mount or excessive speed of travel that causes cavitation near the transducer face. |
A Transducer Field Checklist
If bad signal does sneak past your scrutinizing eyes, fear not, you can always edit your output with EcoSound’s Trip Replay feature as seen in our YouTube video series.
The polygon tool is one of BioBase’s strongest features. The ability to calculate total water body, vegetation cover percentage, surface acreage, and more is crucial to environmental management. Reduce the amount of herbicide you need to apply by taking the guess work out of treatments. Pinpoint locations of beneficial vegetation plantings and monitor the success using the vegetation biovolume value created by the polygon tool. The polygon tool is one of the most versatile features and a use can be found in any area of interest. Below is a step by step walkthrough of how to use the polygon tool.
A few things to take into consideration when creating a polygon. First, polygon tool is a very data intensive feature and requires a lot of processing power. In order to limit the demand on server, we must limit simultaneous polygon requests system wide to two. After clicking save and the polygon tool begins the calculations you should see the following statement in the upper right hand corner “Generating statistics: please be patient. Response times depend on waterbody size and amount of data.”. You will also see a spinning circle indicating the tool is working this may take up to 3 minutes depending on the data and the polygon. If you receive a prompt to try again at a later time, the servers may be busy processing other polygons. Try waiting a few minutes then trying again.
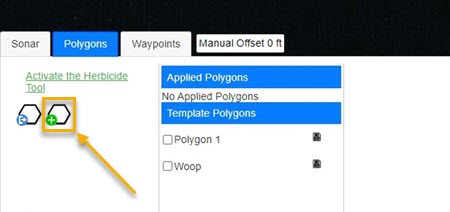
Step 1. Select the “Polygon” tab

Step 2. Click create polygon button
Step 3. Name the polygon

Step 4. Add a description to the polygon

Step 5. Draw the polygon by clicking points, double click to end the drawing

Step 6. Save the polygon

Step 7. Data Table

The polygon management tool allows subscribers to create a polygon within their data for automated processing and assessment of specific boundaries within an upload. After you gather Lowrance sonar data and upload it to your BioBase account to create a bathymetric, vegetation and hardness maps, you can determine water volumes, acres, max and average depths, vegetation average biovolume percentage, vegetation cover percentage and more.
More information on the polygon tool can be found on our support resources page –Support Resources Operators Guide
The days of estimating water volumes are over. Even though we were already providing detailed water volume analysis of the area covered, BioBase will now allow you to create and manage your treatment zones and areas of concern in greater detail. BioBase is taking lake management and habitat analysis to the next level and automating everything you need to take your collected data full circle. For more information on Navico’s sustainability initiative click Here
