
By Herb Garcia
Sailing enthusiast and BioBase Ambassador
Lake Minnetonka is one of the largest and most heavily used recreational lakes in Minnesota and is composed of an interconnected system of bays (Figure 1). Every summer, a rooted invasive aquatic plant, Eurasian watermilfoil creates thick bottom to surface mats in many areas of the lake. While these mats may occur anywhere on the lake, they generally are thickest in certain shallow areas such as the Diamond Reef area in the main lake of Lake Minnetonka (officially described as Lower Lake North). This reef is popular with anglers, power boaters, and sailors. On any given night or weekend, well over a hundred keelboats may take part in regular club racing events or regattas here. World class level sailors, including Olympic champions, America’s Cup, and other accomplished sailors regularly race on the lake and the competition can be intense. When competition is tight, every advantage is important.

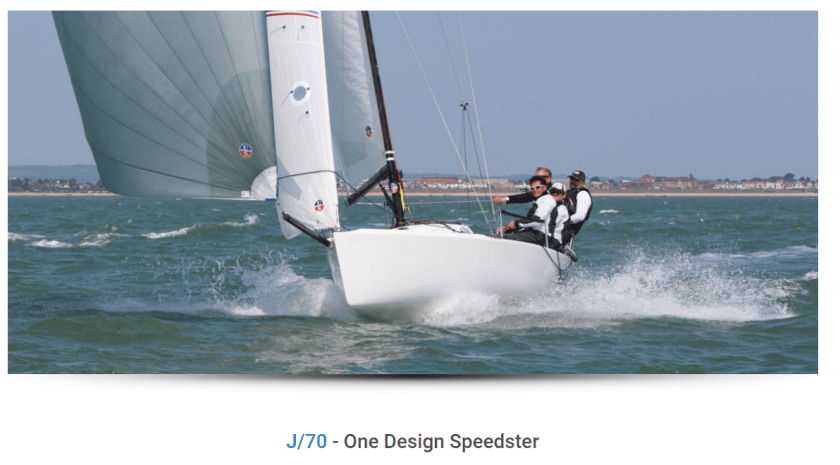
One of the fleets racing on Lake Minnetonka is the J70, a one design (i.e., every boat is identical) keelboat with draft of just under 5 feet (1.5 m; Figure 2). In shallow, weedy environments, the keel on these boats will snag vegetation, and the drag on the hull by vegetation taller than the draft, will slow the boat down.
I was asked by a team to use BioBase to map these obstructions and provide both a map of underwater weeds, and also create a waypoint obstruction zone so they could avoid certain areas.

The target area is outlined above in Figure 3. Although there is useful data, large gaps remained, and the existing data didn’t provide enough detail for our purpose. Ultimately, I spent several hours on a beautiful Sunday afternoon driving transects across the area and recording waypoints where I noted particularly shallow weed areas (Figure 4).

All of the data was gathered from a 21-foot outboard Flats Cat fishing boat outfitted with a Simrad EV03 9-inch with a standard 200khz skimmer transducer, although any Lowrance Elite (and up) or B&G Zeus chartplotter is compatible. I removed the MicroSD card with the recorded sonar logs from the chartplotter and uploaded them to biobasemaps.com. Figures 5-7 below are the contour and vegetation maps of the investigated area processed by BioBase’s EcoSound algorithms:


The final deliverable was this overlain set of waypoints (recorded at the same time as the mapping) which they could enter into their handheld gps, C-MAP App, or Chartplotter (Figure 8). If users link their newer generation Lowrance, Simrad, or B&G chartplotter to the app, waypoints will be synced automatically to the companion branded app.

The possibilities are numerous for how a better understanding of our underwater environments help us better appreciate and enjoy our water resources. BioBase coupled with Lowrance/Simrad/B&G democtratizes the mapping process, removing the requirment of advanced degrees and thousands of dollars of sophisticated survey equipment to create accurate and useful maps of the underwater environment for research, fishing OR racing yachts!