What is EcoSat?
EcoSat delivers a one-of-it’s-kind semi-automated cloud processing of very high resolution satellite imagery to map nearshore vegetation and coastal benthic habitats. EcoSat uses the latest multi-spectral imagery from reputable providers such as Digital Globe (World View 2,3 and 4), Airbus Defence and Space (Pleiades), and ESA’s Sentinel program and industry standard image processing techniques. Sophisticated Amazon Web Service cloud infrastructure rapidly processes imagery, creates reports and imagery tiles, and delivers detailed habitat maps to user’s BioBase dashboard where it can be analyzed and shared. Average turnaround time from imagery tasking order to delivery of results is 60 days. The rapid and standard processing methods are allowing entities like the Florida Fish and Wildlife Conservation Commission to establish regular monitoring programs for emergent vegetation. The extremely long and expensive one-off nature of conventional remote sensing mapping projects using non-repeatable tailored techniques has prevented natural resource entities from assessing the degree that habitats are changing as a result of environmental stressors such as invasive species invasions and climate change.
Although BioBase EcoSound was originally developed for aquatic vegetation mapping in inland lakes, users along both US Coasts have helped us diversify its toolbox to now be a powerful coastal habitat mapping tool as well!
One of the biggest challenges of mapping coastal habitats is their tidal influence with depths changing harmonically based on the moon phase and other factors. Fortunately, however, widespread tide stations and large public databases of tide predictions allow for accurate and precise offsets to georeferenced and time-stamped sonar logs from Lowrance HDS or Elite units uploaded to BioBase EcoSound. BioBase EcoSound immediately queries the nearest tide station to your upload (up to 75 km) and adjusts your depth and seagrass or kelp biovolume to the Mean Lower Low Water (MLLW) datum every 5 minutes. Tidal statistics (Avg., start, stop, high, low,) are archived in your account for each trip.
The polygon tool is one of BioBase’s strongest features. The ability to calculate total water body, vegetation cover percentage, surface acreage, and more is crucial to environmental management. Reduce the amount of herbicide you need to apply by taking the guess work out of treatments. Pinpoint locations of beneficial vegetation plantings and monitor the success using the vegetation biovolume value created by the polygon tool. The polygon tool is one of the most versatile features and a use can be found in any area of interest. Below is a step by step walkthrough of how to use the polygon tool.
A few things to take into consideration when creating a polygon. First, polygon tool is a very data intensive feature and requires a lot of processing power. In order to limit the demand on server, we must limit simultaneous polygon requests system wide to two. After clicking save and the polygon tool begins the calculations you should see the following statement in the upper right hand corner “Generating statistics: please be patient. Response times depend on waterbody size and amount of data.”. You will also see a spinning circle indicating the tool is working this may take up to 3 minutes depending on the data and the polygon. If you receive a prompt to try again at a later time, the servers may be busy processing other polygons. Try waiting a few minutes then trying again.
Step 1. Select the “Polygon” tab
Select the Polygon Tab
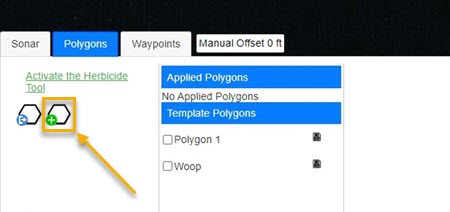
Step 2. Click create polygon button
Click create polygon button
Step 3. Name the polygon
Name the polygon (required)
Step 4. Add a description to the polygon
Add a description to the polygon
Step 5. Draw the polygon by clicking points, double click to end the drawing
Draw the polygon by clicking points, double click to end the drawing
Step 6. Save the polygon
Save the polygon
Step 7. Data Table
Example of data table generated by the polygon tool
The polygon management tool allows subscribers to create a polygon within their data for automated processing and assessment of specific boundaries within an upload. After you gather Lowrance sonar data and upload it to your BioBase account to create a bathymetric, vegetation and hardness maps, you can determine water volumes, acres, max and average depths, vegetation average biovolume percentage, vegetation cover percentage and more.
The days of estimating water volumes are over. Even though we were already providing detailed water volume analysis of the area covered, BioBase will now allow you to create and manage your treatment zones and areas of concern in greater detail. BioBase is taking lake management and habitat analysis to the next level and automating everything you need to take your collected data full circle. For more information on Navico’s sustainability initiative click Here