Delineating Invasive Plant Beds the Easy Way

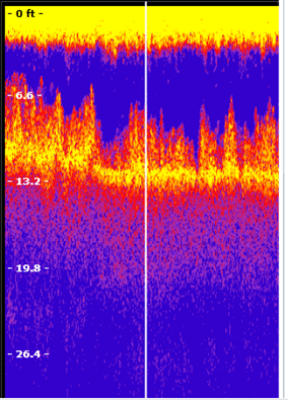
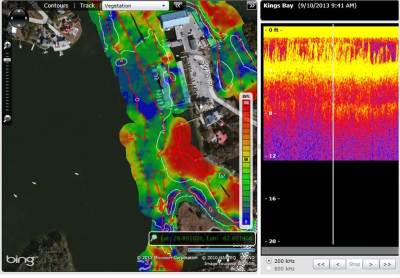
Effective management of invasive aquatic plants requires some fundamental but previously difficult prerequisites.  First, you have to find the infestations; not easy when you can’t see underwater.  Second, you have to create boundaries of the infestation; also not easy when you can’t see underwater or when the plant does not behave and form perfect surface-growing patches that you can trace with your GPS.  So it used to be a game of darts using whatever tools available (e.g. rakes, manual interpretation of GPS and sonar, aquascopes, snorkeling, scribbling on paper maps) to crudely estimate the extent of invasive plant growth.  Needless to say, delineations using this technique have been crude leading to equally crude and often ineffective management.

Continue reading “Delineating Invasive Plant Beds the Easy Way”

Innovations in Storm Pond Assessment and Tracking: Minnesota Demo

Be prepared for new Municipal Separate Storm Sewer System (MS4) rules with cost-effective solutions for inventorying the compliance of all of your stormwater basins.

When: Friday May 2nd, 2014

Where: A stormwater pond site in Roseville, MN (contact Ray Valley for details)

Attendees will learn about innovations to help them rapidly:

  • COLLECTPlatypus LLC will demonstrate bottom depth and composition data collection with Lowrance depth sounders and chartplotters on autonomous boats on a Roseville, MN Stormwater Basin.
  • PROCESS – Navico, Inc., makers of Lowrance and BioBase will demonstrate automated data processing and GIS map creation of collected bathymetric data.
  • TRACK – Flatrock Geographics, Makers of PondTrack (*new*) and MapFeeder will demonstrate cloud-based inventory and data management tools.

Reps from all companies will discuss individual and bundling pricing options. Please contact Ray Valley (651-303-5265 ray.valley@navico.com) to reserve a space. Registration is free but space is limited!

Pond Mapping: Why Wait Until Spring?

At this writing, a “Polar Vortex” is invading the Upper Midwestern US.  Temperatures are peaking in the Twin Cities of Minnesota at -11 F give or take a few degrees.  Although this temperature is a wee-bit extreme for even the hardiest of souls, Momentum Environmental recently explored how they could capitalize on the long winter months in Minnesota to rapidly map municipal stormwater basins.  Local municipalities across the US are looking for cost-effective ways to rapidly inventory their stormwater basin infrastructure to ensure compliance with new State and Federal mandates.

Continue reading “Pond Mapping: Why Wait Until Spring?”

New BioBase Merge and Buffer Features

Are you making a list of things to be thankful for?  What about adding NEW FEATURES IN BIOBASE just in time for Thanksgiving?!?  We’re releasing new features today that include the ability to delete outdated merges from your account and the ability to change the buffer on single and merged trips!

(1) New “DELETE MERGE” Controls


After some testing and use case analysis we’ve just launched a new feature that will allow you to keep your merge list nice and clean or redo a merge.  This is great in scenarios where users would like to continuously add new data to a merge or would like to reprocess a merge without adding to the list of available merges in their account. 

biobase
New Delete Function for ciBioBase Merges

A merge is created based on the combined data sets of individual trips and if the data sets change, a new merge has to be deleted then reprocessed.   At times, our QC team helps make adjustments to your output for the best map or to shapefiles boundaries for the best interpolation and then communicates these changes to you.  They also show up in your reports for individual trips.  Now, an old merge can be deleted and you can kick off a new merge with the updates.  We think this will be a useful tool for better account management!


(2) New Interpolation Buffer Controls from 5-300 Meters


Many of you request different buffers for your trips to fill in gaps when our standard 25m buffer isn’t enough.  We’re happy to oblige but we wanted to help you do it faster!   Now you can change buffers in your account without us.

ciBioBase
New User Controls to Change the Buffer Size of Your Maps

We still always use a 1/5 rule meaning that the grid cell size will be adjusted to 1/5 of the buffer size (ex1: 100m buffer, 20m grids; ex2 50m buffer, 10m grid cell size).  If you need a different combination than the 1/5 rule (like a 1m grid and 10m buffer) let us know and we can do it for you and let you know the ramifications.   In the reprocessing tab you can send individual trips back for reprocessing with an increased buffer of up to 300 meters.  In the merge tab you can kick off a new merge with a pre-set buffer as part of this new merge feature (see the image above).  If you need to change the buffer in the merge you can make changes in the trip reprocessing tab when it’s complete.   It’s sounds complicated in writing but we’re confident that you’ll see the changes as soon as you play around with it!  Once you’ve uploaded and paid for processing on a per lake or unlimited subscription model, all edits and reprocesses are free!  As always, contact us with questions.

*Please keep in mind that an error coefficient of the interpolation is positively correlated with the increase in a buffer and you’ll want to communicate this with a customer or constituent.  As you increase your buffer, you’ll be estimating more between transects which could be affected by highly variable point data or aquatic systems.  Also, the buffer is always on both sides of the transect meaning that if you have 50 meters between your transects you only need a 25 meter buffer because 25 meters on both sides of the transect will complete the map.

New Pricing for 2014


We’re not ready to fully announce our new pricing for 2014 but we wanted to let you know that we’ve made some big changes and the results will be much cleaner.   The new subscription model will help smaller municipalities get started with BioBase.  We’ll also be announcing new stormwater monitoring options and pricing packages for municipalities that need to start keep an inventory of these assets or would like a more efficient way of process and warehousing the data.   Just a little teaser . . .but let us know if you have specific questions.

Platypus Offers New Opportunites in Pond Mapping

Researchers Paul and John Scerri and their team at Carnegie Mellon University have developed an autonomous vehicle called Platypus that can be used for a wide variety of aquatic applications.  One application we see customers struggle with is mapping small ponds.

Platypus getting fitted with a Lowrance HDS and transducer

Recently, the Platypus development group teamed up with Tim Wood at Aquatic Edge Consulting and Contour Innovations to test the use of a Platypus for sonar data collection and bathymetric and vegetation mapping of a pond.  They rigged up the autonomous vehicle with a small Lowrance HDS 5 and sent it into the waterbody.

Getting the data collection process going and testing while on the water


A close-up view of Platypus

They quickly acquired the data set recorded to their SD card, uploaded the .SL2 files to their account at http://www.BioBase.com and within minutes all of their files were done processing and could be merged into a full map.  The pond map output looks great!

You can check out a video of the operation here: Platypus in action

Platypus gathering sonar data for BioBase

Customers were happy, no one got wet, and the results speak for themselves.  Great job guys!

If you have an innovative way of collecting data for processing with BioBase, let us know and we’d  be happy to help!

New Survey Findings: Use of Geographic Information Systems by Fisheries Management Agencies

Recently Brandon Eder from the Nebraska Game and Parks Commission and Ben Neely from the Kansas Department of Wildlife, Parks, and Tourism published some interesting findings in Fisheries pages 491-495 regarding the use of GIS in fisheries management agencies in the US and Canada (see abstract below).  Technology is opening horizons and aquatic resource practitioners now have a variety of intuitive tools at their disposal to characterize and describe the complex spatial environments they are charged with managing.

Better characterization and description of aquatic environments leads to better management decisions and public welfare.  How can we promote more academic training and utilization of GIS tools for aquatic resource practitioners?  Eder and Neely have some advice that is worth a read.

ABSTRACT: Use of geographic information systems (GIS) in fisheries science has increased in prevalence since its introduction in the late 1980s, but use among and within fisheries management agencies has not been quantified. We surveyed 89 administrators of fisheries management agencies in the United States and Canada to determine the current status of GIS in fisheries management and received 54 responses (61% return rate). Survey respondents indicated that GIS was used to help manage fish populations, and 63% of respondents believed that GIS was either “very useful” or “extremely useful” for meeting agency objectives. However, most GIS work conducted by fisheries management agencies was executed by few individuals within the agency or by contracted service. Barriers preventing more widespread use by managers within agencies included lack of knowledge or training and limited time to use GIS in job duties. Our results suggest that GIS is an important tool for fisheries management. Further, GIS use within an agency might be increased by focusing on increased biologist participation in training exercises, integration with existing job duties, and recognizing diversity among GIS software.

Guest Blog: Precision aquatic plant assessment and management in Michigan Lakes

By Jennifer L. Jermalowicz-Jones
Restorative LakeSciences is actively involved in the management and restoration of nearly 60 lakes in the state of Michigan and on water bodies in other states such as California and Wisconsin.  As an innovative specialty firm of advanced-degreed limnology experts, our goal is to provide thorough educational training to lake communities while using the most innovative technologies for lake improvements.  BioBase software (Contour Innovations, LLC) in combination with the Lowrance® HDS8 side- and down-scanning capabilities allows us to precisely determine the biovolume of the submersed aquatic vegetation in inland lakes.  Additionally, it also assists in the determination of individual aquatic vegetation bed areas that are mapped by aquatic botanists to be treated precisely with systemic or contact aquatic herbicides or with other removal technologies (Figure 1).  This technology has resulted in highly effective reductions of nuisance aquatic vegetation biovolume and bed densities due to the precision of treatments.  As a result, all of our lake management communities have been satisfied with the strategy and can easily see significant progress within a single season.
Restorative Lake Sciences, Evans Lake, Michigan, ciBioBase, BioBase, Eurasian watermilfoil, mapping, aquatic plants
Figure 1. ciBioBase aquatic vegetation heatmap collected by Grant Jones, Field Operations Manager, Restorative Lake Sciences (left) and Eurasian watermilfoil beds delineated with companion species surveys and the BioBase polygon tool.  Polygons were exported from BioBase and uploaded to Google Earth.
Jennifer L. Jermalowicz-Jones, MS, Ph.D Candidate, is the Water Resources Director at Restorative Lake Sciences and oversees over nearly 60 inland lake projects which include aquatic vegetation mapping and management, lake sediment reduction studies and management, algal quantification and identification and algal management programs, and watershed management programs.  She has over 24 years of experience in lake research and management and is pursuing her doctoral degree from Michigan State University in Water Resource Management.  She is also the President of the Michigan Chapter of the North American Lake Management Society, serves as the Science Advisory Chair on the Michigan Lake and Stream Associations Executive Board of Directors, has won numerous awards and grants for her aquatic ecosystem research, and has presented numerous papers at state and national conferences on water resource and lake management.

Amendment to BioBase Guest Blog: GIS Tools helping CAP manage sedimentation

Earlier this year, Senior Biologist Scott Bryan from the Central Arizona Project (CAP) blogged about how the CAP is using BioBase to manage sedimentation in Arizona’s lifeblood 336-mile aqueduct.  Since then, CAP GIS Wizard Glenn Emanuel has worked some amazing magic on the BioBase grid exports using Spatial and 3D Analyst Extensions for ArcGIS (Figure 1).

Central Arizona Project, sedimentation, Lowrance, ciBioBase, BioBase, sonar, mapping, acoustics
Figure 1. Images showing the change in sediment volume prior to and after experimental dredging activities in a Forebay of the CAP canal.  The Raster Calculator in ArcGIS’s Spatial Analyst was used to subtract a “current” bathymetry from a baseline bathymetry (e.g., “as built”) to estimate sediment height and volume.  Images are 3-dimensionally enhanced using 3D Analyst for ArcGIS. Image courtesy of Scott Bryan and Glenn Emanuel, Central Arizona Project

The data and images allow CAP to make informed decisions regarding the efficiency of sediment removal operations.  In addition, ArcScene was used to produce a 3D scene of the forebay (Figure 2), which can then be animated with a video fly-through.

Central Arizona Project, sedimentation, ciBioBase, ArcScene, Lowrance, BioBase, sonar, mapping, acoustics
Figure 2. “Fly-through” images of sediment height  in Little Harquahala Forebay in the CAP Canal collected by Lowrance HDS sonar and GPS, BioBase cloud processing software, and finally exported/imported into ArcScene.  Image courtesy of Scott Bryan and Glenn Emanuel, Central Arizona Project.

Any user of BioBase properly equipped with the proper third party GIS software can create these amazing map products that are more than just pretty pictures.  They create a real-life, tangible perspective of aquatic resource conditions that BioBase users are interested in managing, protecting, and restoring.

Getting good BioBase EcoSound outputs depends on a good transducer mount!

EcoSound is a powerful and intuitive aquatic resource data processing engine that professionals across the globe are coming to recognize.  However, the quality of automated outputs greatly hinge on a proper Lowrance transducer mount.  If the transducer is off at an angle, the acoustic cone will intercept bottom at an angle and will falsely read depth, bottom composition/hardness, and vegetation height (Figure 1).

Figure 1. Example sonar log from a transducer face that is not 180 degrees with bottom as seen in Lowrance’s SonarViewer


Strategies for installing your transducer.
There are a wealth of online resources via YouTube, Google, and our own blog series (for example see our portability blog) about proper transducer mounts.  Just search “Lowrance Transducer Installation” and you’ll have a wealth of self-help resources at your disposal.  An output from a properly mounted transducer should look like Figures 2 and 3 where the bottom signal is clearly distinguishable from aquatic vegetation.

Figure 2.  Screen shot from a Lowrance HDS7 Gen2 Touch of a clear bottom signal and submerged aquatic vegetation from a properly mounted 200 kHz skimmer transducer.
Figure 3.  Example of what a clear 200 kHz signal over a vegetated bottom looks like in the EcoSound Trip Replay screen.

Often, aquatic vegetation grows to the surface of lakes and one of the unique strengths of EcoSound is that the vegetation detection algorithm recognizes conditions that appear to be surface growing vegetation and classifies the growth as such (i.e., biovolume = 100%).  Still, in order for the algorithm to function in these environments, some signal must periodically pass through the vegetation canopy and get “peaks” at bottom deeper than 2.4 ft (EcoSound minimum depth for vegetation mapping; Figure 4).  If you are mapping areas shallower than this depth, you can add manual vegetation coordinates to unmapped areas (see a CI YouTube video on how to do this)

Figure 4.  Example of a good signal in surface growing vegetation.  The bottom still tracks occasional depths of greater than 2.4 feet.  Long periods of no depth signal or depths less than 2.4 feet will result in unmapped areas and will require manually adding vegetation coordinates to your EcoSound output.

Monitor SONAR screen while you map
Because having a clear transducer signal is so critical for quality EcoSound data and map products we recommend that users verify a clear Sonar signal in an open water area prior to logging.  Drive your boat at different speeds and evaluate at what speed “slivers” start to appear in the bottom signal (Figure 5).  These slivers represent acoustic “misses” and typically result from cavitation of water around the transducer face.  Periodic slivers or misses while recording are ok, but we recommend that users monitor their SONAR page and take measures to minimize these disturbances (e.g., slow down or adjust the depth of the transducer a few inches – sometimes that’s all it takes).

Figure 5. An example of where the acoustic signal “missed” the bottom target (white slivered areas).  These misses typically result from either an improper transducer mount or excessive speed of travel that causes cavitation near the transducer face.

A Transducer Field Checklist

It might be helpful to ask these questions prior or during recording while looking at your SONAR screen and if the answer is yes to any of them, stop recording and make adjustments.
  1. Does the bottom, fish, or plant targets appear slanted?
  2. Does yellow surface clutter extend a long way into the water column and might possibly obscure vegetation target separation?
  3. Is my depth signal flashing or am I getting no digital reading?
  4. Is my range window jumping around indicating it can’t find depth?
  5. Am I getting a lot of white slivers in my bottom reading?
Editing your EcoSound output

If bad signal does sneak past your scrutinizing eyes, fear not, you can always edit your output with EcoSound’s Trip Replay feature as seen in our YouTube video series.

By installing your transducer correctly and monitoring your output you’re almost guaranteed a quality map of lake, river, or coastal habitats with EcoSound.  Contact us at info@biobasemaps.com to learn more.

Color Enhancing your Sonar Log

ciBioBase’s Trip Replay feature that couples bottom depth, aquatic vegetation biovolume, and bottom hardness maps with your actual Sonar Log empowers you with a verification tool that ensures an accurate map in every system you map, every time.  The sonar log also provides users and our Quality Control team helpful information about signal quality and transducer placement that can help both parties diagnose issues.

A little known feature in ciBioBase allows users to reprocess their Lowrance HDS/Elite sonar log at different color and sensitivity settings (Figure 1).

Figure 1. Trip Reprocessing Tab that allows ciBioBase users to reprocess their trips with new edits.  Try reprocessing your sonar log at a higher color (e.g., 240) for “cooling” the colors in your sonar log in ciBioBase and to bring out subtle bottom features.

Sometimes, your Sonar Log may look a little too “hot” making it difficult to distinguish between plants and bottom (Figure 2).

Lowrance, ciBioBase, Sonar Log
Figure 2.  Sonar Log showing colors that may be “too hot” to distinguish between plants and bottom.

Try reprocessing the sonar log at a colorline of 240 (default is 220).  This will bring in “cooler” colors to the sonar log and may help you better distinguish subtle bottom features and gaps in plant beds (Figure 3).

Figure 3.  Sonar Log reprocessed with a colorline of 240.

Alternatively, Lowrance has a powerful free desktop software program called SonarViewer which allows you to replay your Sonar Log with options to dynamically control sensitivity, colorline, zoom, and range (Figure 4).

Figure 4.  SonarViewer is a free download from Lowrance and has a range of tools for enhancing the contrast of bottom features detected by your Lowrance HDS or Elite.

Use SonarViewer to review your files prior to upload to ciBioBase if you suspect possible signal quality issues or are testing different transducer setups for optimal signal quality.  Signal Quality should also be continually monitored by watching your SONAR page on your HDS or Elite while collecting data on the water.  A helpful rule of thumb is that a signal that is clear and crisp to your eyes is most likely clear and crisp to ciBioBase algorithms.

For more Tips & Tricks visit our Support Resources Page –Here


Translate »